
 Price Showing Positive Signs: ETH, BTC Gaining Strength")
- Ripple price traded higher recently and broke the $0.3950 and $0.4120 resistances against the US dollar.
- The price tested the $0.4200 resistance area and it is currently correcting gains.
- There is a connecting bullish trend line forming with support at $0.3850 on the hourly chart of the XRP/USD pair (data source from Kraken).
- The pair remains supported on dips and it could bounce back after testing the $0.3980 or $0.3950 support.
Ripple price is showing positive signs above $0.3950 against the US Dollar, while declining vs bitcoin. XRP remains well bid and dips are likely to present buying opportunities.
Ripple Price Analysis
After forming a strong support base above the $0.3660 level, ripple price climbed higher against the US Dollar. The XRP/USD pair traded above a couple of important resistances near the $0.3800 and $0.3850 levels. The price moved into a positive zone above the $0.3920 level. There was a close above the $0.3950 level and the 100 hourly simple moving average. Besides, there was a break above a declining channel at $0.3860 to start the recent upward move.
Finally, the price broke the $0.4000 and $0.4120 resistance levels. It traded as high as $0.4205 and it is currently correcting gains. It tested the $0.4080 level and the 23.6% Fib retracement level of the recent wave from the $0.3766 low to $0.4205 high. On the downside, there are many supports near the $0.4000, $0.3980 and $0.3950 levels. Moreover, the 50% Fib retracement level of the recent wave from the $0.3766 low to $0.4205 high is near the $0.3985 level to act as a strong support.
Therefore, if the price continues to move down, it could find support near $0.4000 or $0.3950. Moreover, there is a connecting bullish trend line forming with support at $0.3850 on the hourly chart of the XRP/USD pair. On the upside, an initial resistance is near the $0.4150 level, followed by the $0.4200 zone. A successful break above the $0.4205 high might clear the path for more gains towards the $0.4250 and $0.4320 in the coming sessions.
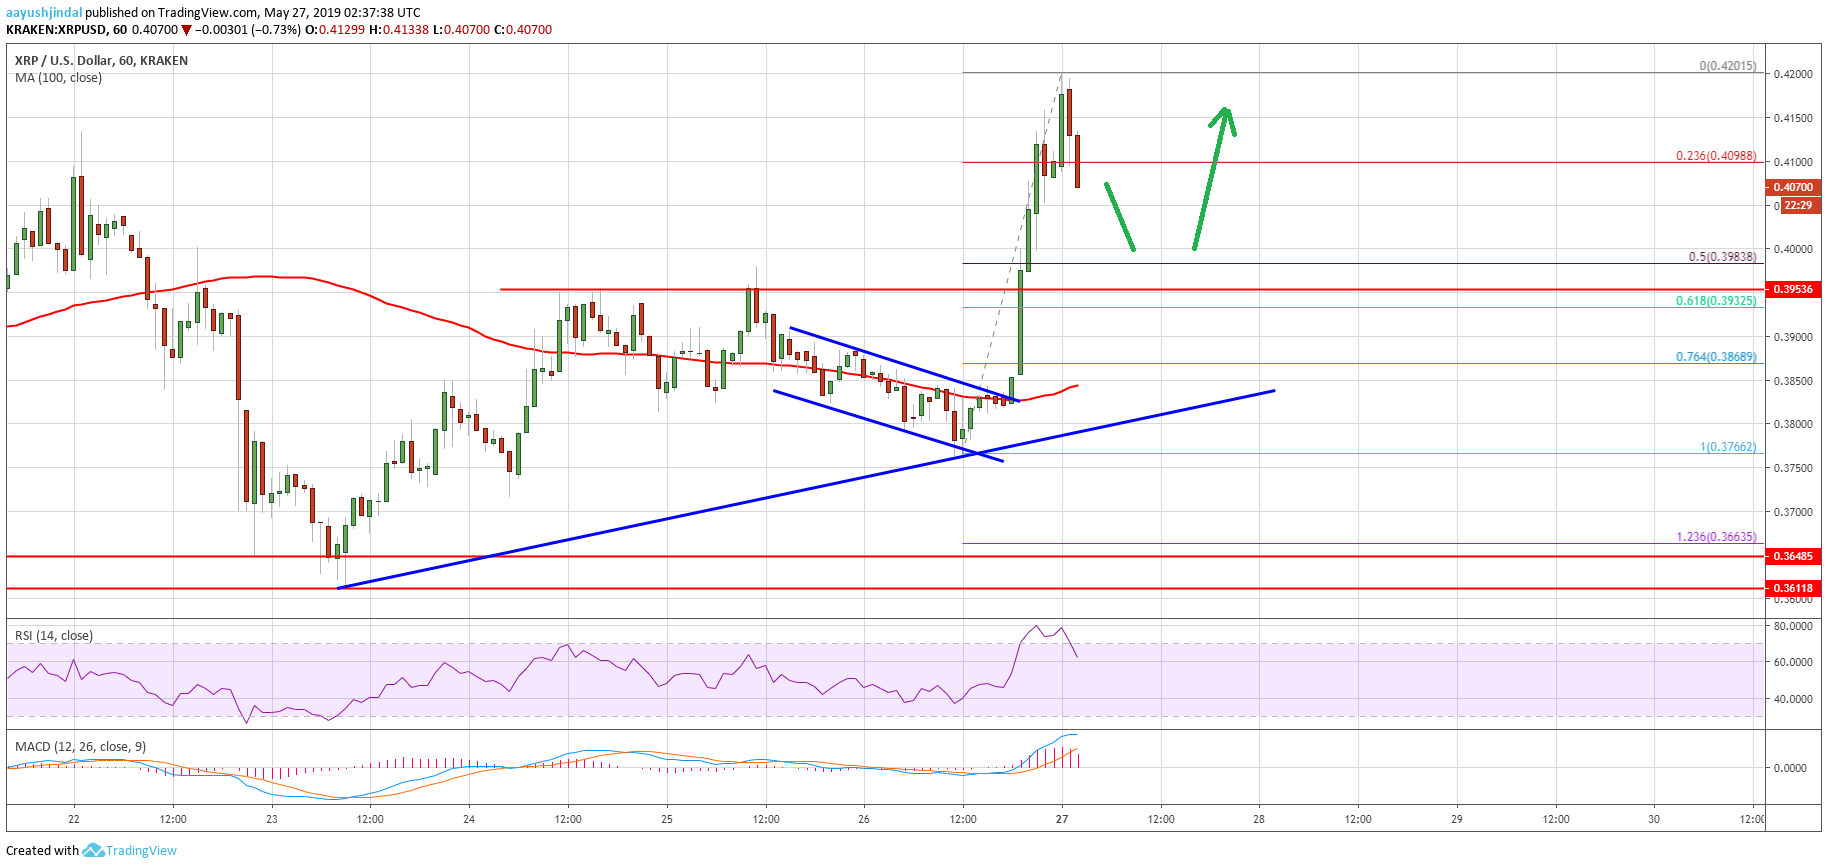
Looking at the chart, ripple price is clearly trading with a positive angle above the $0.3950. In the short term, there could be range moves above $0.3980 or $0.3950. However, the correction could complete near $0.4000 or $0.3950 before a fresh increase. On the upside, the bulls are likely to take control above the $0.4200 pivot zone.
Technical Indicators
Hourly MACD – The MACD for XRP/USD is currently gaining strength in the bullish zone.
Hourly RSI (Relative Strength Index) – The RSI for XRP/USD is currently correcting lower from the overbought zone to 65.
Major Support Levels – $0.4000, $0.3980 and $0.3950.
Major Resistance Levels – $0.4150, $0.4200 and $0.4320.
The post Ripple (XRP) Price Showing Positive Signs: ETH, BTC Gaining Strength appeared first on NewsBTC.


